|
|
|
Team statistics
| Members |
146 |
| Members running new model |
116 |
79.5% |
| New model years simulated |
22,676 |
| Computers |
239 |
| Computers running new model |
199 |
83.3% |
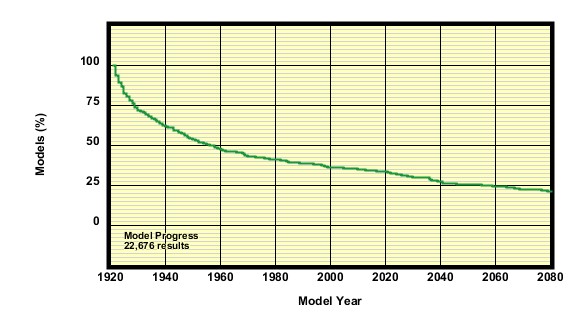
| Model progress for the whole team |
The table and graph below show how the team's models are progressing.
For example, 351 models have completed the first year, to reach 1921;
of these models, 251 have gone on to 1930.
Of the 100 models that have completed one year but not yet completed the decade,
some may have stopped, others are simply running relatively slowly or have been suspended for some reason, and the remainder
have probably been started only in the last few days.
Since a model must pass through the early years to reach the later years, the numbers in the table always go down from left
to right and, similarly, the curve in the graph always falls.
|
1921
1 yr |
1930 |
1940
20 yr |
1950 |
1960
40 yr |
1970 |
1980
60 yr |
1990 |
2000
80 yr |
2010 |
2020
100 yr |
2030 |
2040
120 yr |
2050 |
2060
140 yr |
2070 |
2080
160 yr |
| 351 |
251 |
217 |
188 |
166 |
151 |
144 |
135 |
127 |
122 |
118 |
105 |
95 |
89 |
84 |
79 |
73 |
 |
|
last 7 days |
last 14 days |
last 28 days |
last 60 days |
| Members submitting results |
0 |
0 |
0 |
1 |
| Results submitted |
0 |
0 |
0 |
3 |
Please suggest improvements to this page ...
Last update: 2009-08-07 02:13
|